| |
GCImagePresenter |
| A Database on Histological Images of Murine Splenic Germinal Centers | |
 |
 |
 |
 |
 |
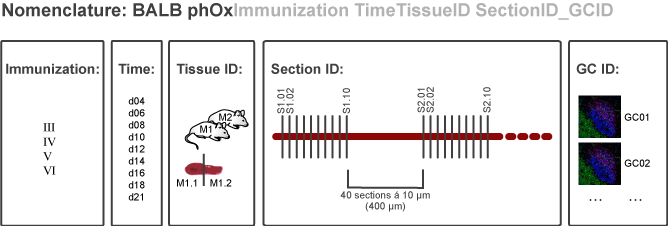
| Immunization | Tissue sampling | Cryosectioning | Immunohistology | Quantitative |
| fluorescence staining | immunohistology |
Antibodies. The following antibodies and other reagents were used to visualize splenic architecture and to detect GC cell populations: unconjugated rat IgG2a to mouse Ki-67 (clone Tec-3, Dako, Glostrup, Denmark); biotin-labeled antibody to mouse FDC (clone FDC-M2, ImmunoK, Abingdon, U.K.); Alexa488-labeled anti-mouse CD3 (clone KT3, AbD Serotec, Düsseldorf, Germany); Alexa488-labeled anti-mouse CD68 (clone FA-11, AbD Serotec, Düsseldorf, Germany); Alexa647-labeled anti-rat IgG (Invitrogen, Karlsruhe, Germany); streptavidin-Alexa546 and streptavidin-Alexa647 (Invitrogen, Karlsruhe, Germany).
Triple immunofluorescence staining. Prior to staining, spleen sections were pretreated by fixation in ice-cold 1% PFA for 30 min and permeabilization in ice-cold 1% sodium citrate containing 1% Triton X-100 (Promega, Mannheim, Germany) for 2 min. Spleen sections were blocked in PBS containing 3% BSA (PBS/BSA) for 30 min.
For evaluation of GC T cells (Staining 1), spleen sections were triple stained with anti-Ki-67 for proliferating cells, biotin-anti-FDC-M2 for FDC networks and Alexa488-anti-CD3 for T cells. Bound Ki-67 and biotinylated FDC-M2 antibody were detected using Alexa647-anti-rat IgG and strepatvidin-Alexa546, respectively.
For evaluation of GC macrophages (Staining 2), spleen sections were triple stained with anti-Ki-67 for proliferating cells, biotin-anti-FDC-M2 for FDC networks and Alexa488-anti-CD68 for macrophages. Bound Ki-67 and biotinylated FDC-M2 antibody were detected using Alexa647-anti-rat IgG and strepatvidin-Alexa546, respectively.
For evaluation of apoptotic nuclei (Staining 3), terminal deoxynucleotidyl transferase dUTP nick end labeling (TUNEL) was performed using the DeadEndTM Colorimetric TUNEL System (Promega, Mannheim, Germany) according to the manufacturer's instructions. Incorporated biotinylated nucleotides were detected using strepatvidin-Alexa647. Spleen sections were additionally stained with Alexa488-anti-CD68 and PNA-Rhodamine for detection of macrophages and germinal centers, respectively. All incubations were carried out in a humidified chamber at 20-25°C for 1 h protected from light and sections were extensively washed in PBS between incubation steps. Stained sections were washed in PBS and mounted in FluoromountG (Southern Biotech, Birmingham, AL).
|
|
|
|
Slides were viewed on a Leica DM Ire2 confocal laser scanning microscope and digital images of individual GCs, as identified by anatomical location and either Ki-67 or PNA reactivity, were acquired using a x40 objective and Leica LCS software. Outer GC and GC light zone boundaries were manually assigned to each GC and saved as regions of interest (ROIs). GC and GC subcompartment areas were measured using ImageJ image analysis software1. Numbers of Ki-67+ cells and TUNEL+ nuclei were determined automatically, applying an adapted version of the Nucleus Counter plugin of ImageJ image analysis software; CD68+ macrophages and CD3+ T cells were counted manually using and adapted version of the Cell Counter plugin. For each mouse and each staining, two independent spleen sections (S1 and S2, distance ≥400 µm) were analyzed.
1 Abramoff, M. D., P. J. Magelhaes, and S. J. Ram. 2004. Image Processing with ImageJ. Biophotonics International 11:36-42. http://rsbweb.nih.gov/ij/